

Events log
Each row is one incident. Open a row for traffic graphs and a source breakdown.1
Open the events log
In the Customer Portal, navigate to DDoS Protection → Reports → Events log.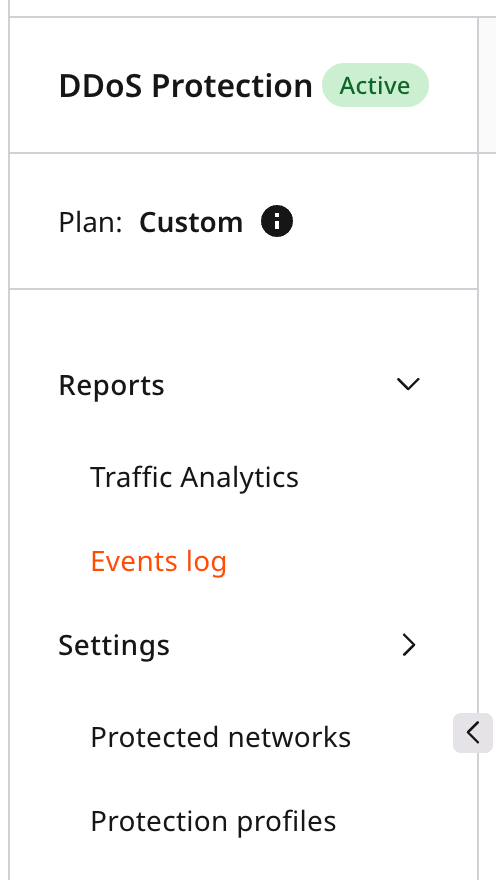
2
Find an incident
Use Search by Target IP, the date range, and the Show all event-type filter to narrow the list. Adjust Entries per page and pagination when the log spans more than one page.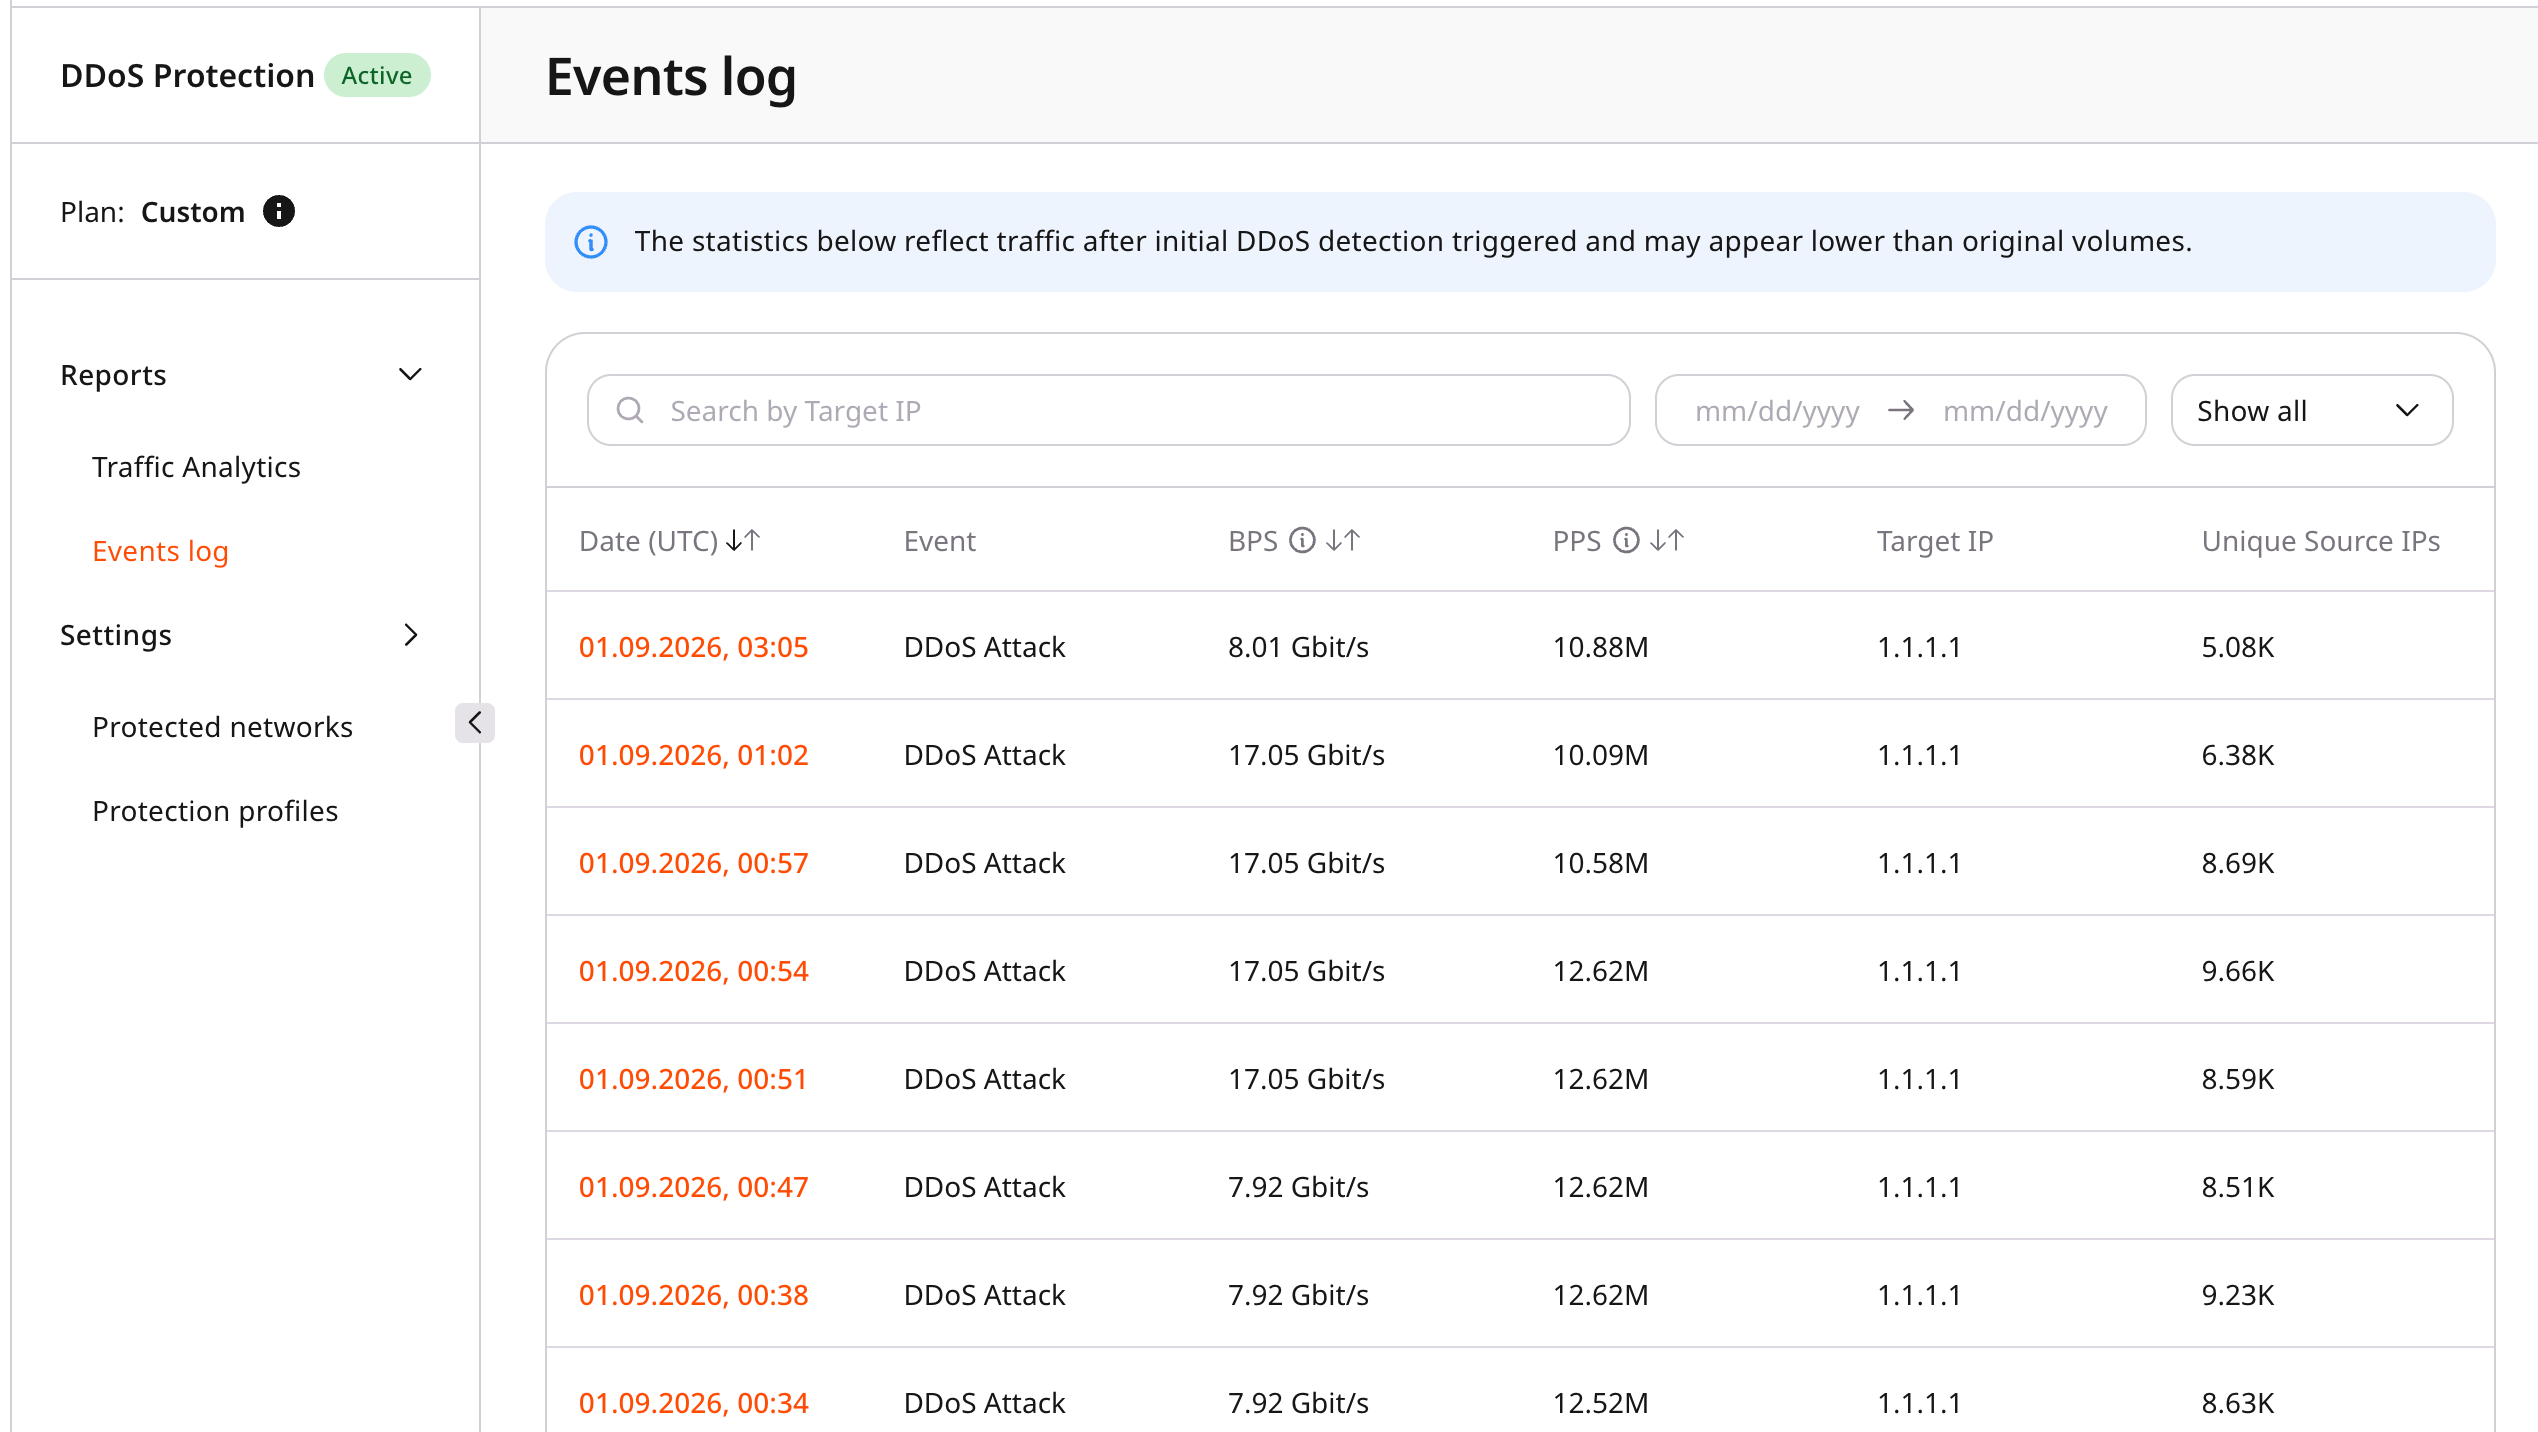
BPS and PPS are the instantaneous rates measured at detection, after filtering has already started. Because part of the flood is suppressed by that point, these values can read lower than the graphs in event details, which reflect the full incident.
A DDoS Attack row is a detected flood. An RTBH row is a remotely triggered black hole that null-routes the target IP until the block lifts.
Event details
Click an event to open attack details for that incident. The view combines a traffic-volume graph with breakdowns by country, IP, port, and protocol.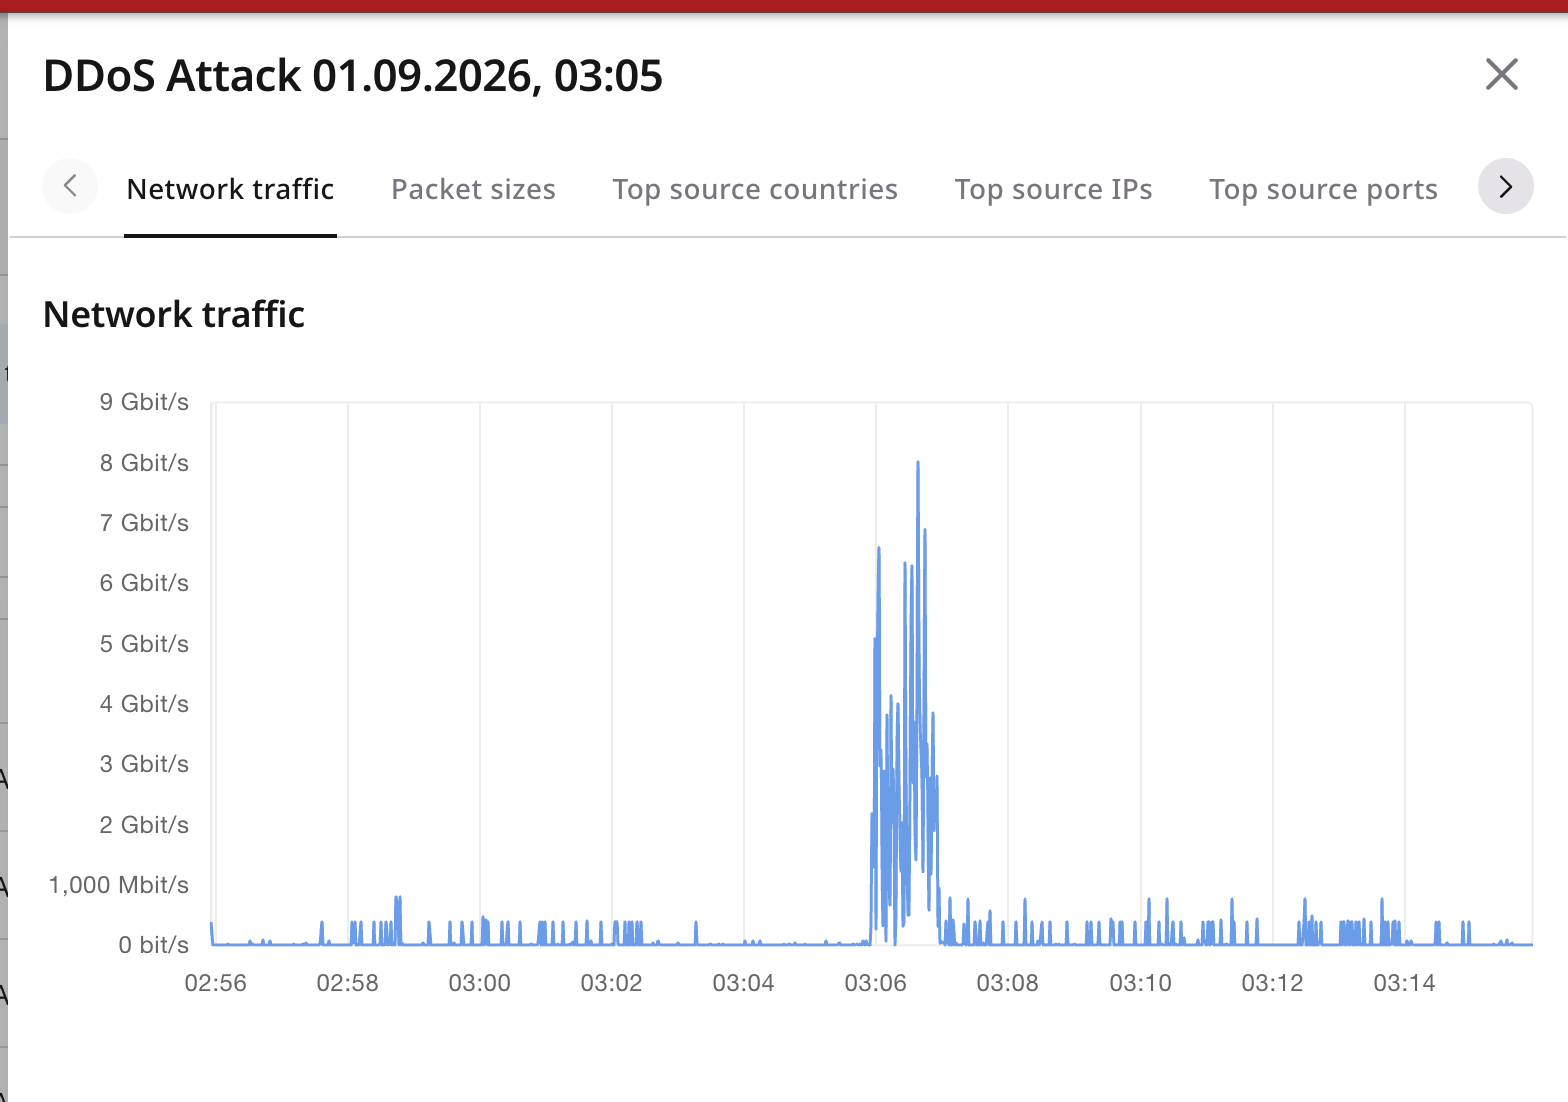
- Network traffic shows volume during the incident.
- Packet sizes shows how packet sizes were distributed.
- Top source countries lists countries that generated the most traffic.
- Top source IPs lists source addresses that generated the most traffic.
- Top source ports lists source ports used in the attack.
- Top destination ports lists destination ports the attack targeted.
- Top protocols lists protocols used in the attack.